
智慧眼鏡人因資料庫 Smart Glasses Ergonomic Database
建立眼鏡設計值與人體測量點的量化驗證方法,讓「這隻眼鏡適合多少人」有數據可以回答。 Building a quantitative validation method linking glasses design values to anthropometric measurement points — so "how many people does this design fit?" can be answered with data.
UX Strategy · Product Design
Design Context
過去 ID 團隊以西方男性頭部中位數作為「標準人頭」進行眼鏡設計——這個數值沒有考慮族群差異,也沒有辦法回答「這款設計能夠覆蓋多少比例的目標使用者」。
The ID team had been using the median Western male head dimensions as the "standard head" for glasses design — a value that accounts for no ethnic variation and cannot answer "what percentage of target users will this design actually fit?"
為解決這個問題,我開始系統性收集並整理人因研究資料,建立資料庫,並發展出一套可量化的設計值覆蓋率驗證方法,同時制定 AR UI 視覺舒適度規範,作為跨部門設計討論的依據。
To address this, I systematically gathered and organized anthropometric research data, built a cross-ethnic database, and developed a quantifiable coverage validation method for design values — alongside an AR UI visual comfort guideline to serve as a cross-disciplinary design reference.
What I Did
- 收集並整理人因資料庫(ISO 15535、ANSUR II、NIOSH、台灣勞工局),涵蓋 5 大族群
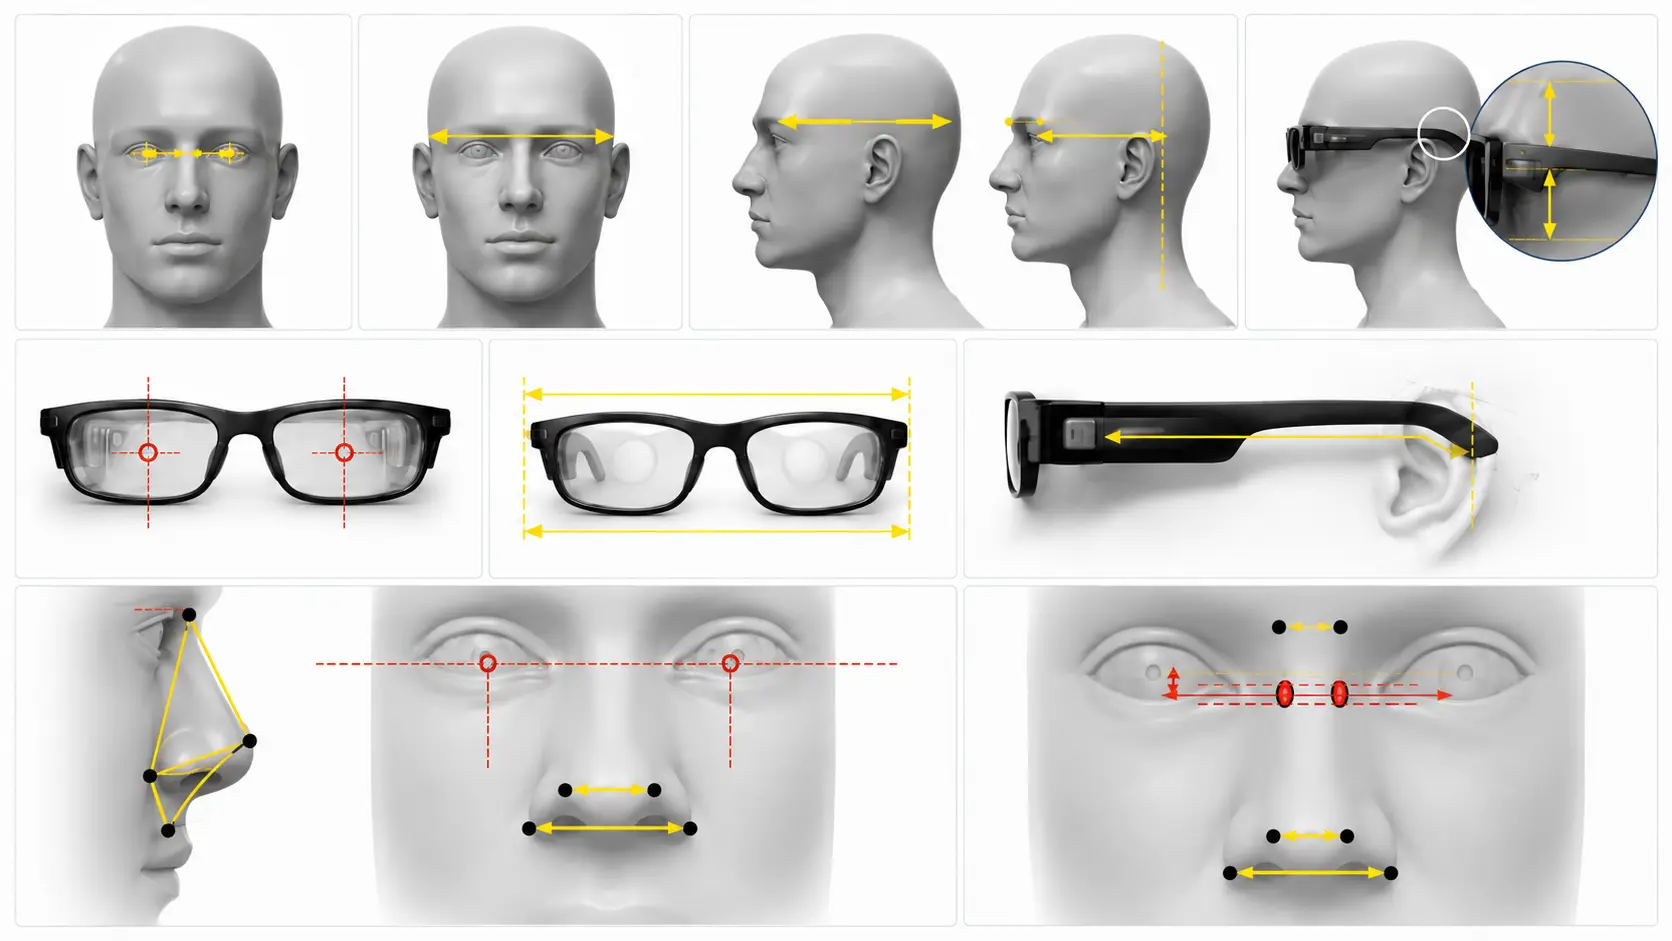
- 定義眼鏡工業設計值與人體測量點的對應關係,建立量化驗證方法
- 將驗證範圍分為三大區:光學設計值、鏡框相關設計值(鏡長/鏡寬)、鼻墊相關設計值
- 應用於 3 款輕量型智慧眼鏡產品的設計驗證
- 撰寫 AR UI 視覺舒適規範,涵蓋物件深度設計、文字視角換算、安全顯示區域
- 2 件眼鏡設計專利申請中,另 2 件規劃撰寫中
- Collected and organized an anthropometric database (ISO 15535, ANSUR II, NIOSH, Taiwan Ministry of Labor) covering 5 ethnic groups
- Defined the mapping between glasses industrial design values and human body measurement points; built the quantitative validation method
- Divided the validation scope into three zones: optical design values, frame design values (temple length / frame width), nose pad design values
- Applied to design validation for 3 lightweight smart glasses products
- Authored AR UI visual comfort guidelines covering object depth design, text visual angle conversion, and safe display zones
- 2 glasses design patents filed; 2 more in planning
Research
核心問題:一款眼鏡的設計值,能夠適合多少人?
Core question: How many people does a given glasses design actually fit?
定義測量點對應關係,讓設計值有覆蓋率可以計算
Defining measurement point mapping so design values have a calculable coverage rate
AR 眼鏡的工業設計值有很多——鏡寬、鏡長、鼻墊尺寸、光學位置等,每一個設計值都需要對應到具體的人體測量點,才能從資料庫中找到有意義的比對數據。
AR glasses have many industrial design values — frame width, temple length, nose pad dimensions, optical position, and more. Each design value needs to be mapped to a specific anthropometric measurement point before meaningful database comparisons can be made.
以眼鏡寬為例:眼鏡的有效配戴寬度,對應到人體頭部兩側顴骨上方平坦位置的橫向距離——這個測量點在眼鏡結構上對應到下勾弧線的前端。確認對應關係之後,再從資料庫取出這個維度的分佈數值,就能評估眼鏡設計值能覆蓋多少比例的人。
Frame width as an example: The effective wearing width of the glasses corresponds to the lateral distance across the flat area above the cheekbones on both sides of the head — which maps to the front end of the undercut curve in the glasses structure. Once the correspondence is established, the dimensional distribution from the database can be used to calculate what percentage of people the design value covers.
資料庫分組方式:依東方(亞洲人)/西方(高加索人為主)× 男性/女性,分為四組,各自計算 5th、50th、95th 分位數值。對照眼鏡設計值,即可評估該設計在不同族群中的覆蓋範圍。
Database grouping: Divided into four sub-groups by East Asian / Western (predominantly Caucasian) × Male / Female. Each sub-group's 5th, 50th, and 95th percentile values are calculated. Comparing these against a glasses design value quantifies that design's coverage across different populations.
資料來源:ISO 15535、ANSUR II、NIOSH、台灣勞工局人體計測資料庫,涵蓋白人、非裔、西語裔、亞洲人、美洲原住民五大族群。
Data sources: ISO 15535, ANSUR II, NIOSH, Taiwan Ministry of Labor anthropometric database — covering five ethnic groups: White, Black, Hispanic, Asian, and Native American.
三大區域,對應不同配戴舒適度來源
Three validation zones, each addressing a different source of wearing comfort
每款產品的設計驗證分為三大區域,各自對應不同的人因測量維度:
Each product's design validation is divided into three zones, each corresponding to different anthropometric dimensions:
- 光學設計值:光學模組位置與眼睛的相對關係,影響影像清晰度與舒適性
- 鏡框相關設計值:鏡長與鏡寬,影響整體配戴合身度
- 鼻墊相關設計值:鼻橋寬度、高度與角度,影響承重分配與長時間配戴舒適度
- Optical design values: The spatial relationship between the optical module and the eye, affecting image clarity and visual comfort
- Frame design values: Temple length and frame width, affecting overall fit
- Nose pad design values: Nose bridge width, height, and angle, affecting weight distribution and long-wear comfort
每個區域的覆蓋率結果,取決於設計值的彈性空間,以及產品主要面向的目標市場族群。
Coverage results for each zone depend on the tolerance range of the design value and the target market ethnic group the product is primarily aimed at.
AR UI Visual Comfort Guidelines
輕量型 AR 眼鏡的 UI 設計,面對的是固定焦平面、小螢幕、以及長時間配戴的視覺疲勞問題——需要一套明確的參數規範來指導設計決策。
Lightweight AR glasses UI design faces a fixed focal plane, small display, and long-wear visual fatigue — requiring a clear parameter spec to guide every design decision.
用等角縮放取代雙眼視差,避免調焦衝突
Use angular scaling instead of binocular disparity to avoid accommodation conflict
大多數 AR 眼鏡的影像焦平面固定在約 1.5–2 m;若再使用雙眼視差讓 UI 元素看起來很近,眼睛的聚散與調焦會產生衝突(VAC,Vergence-Accommodation Conflict),造成視覺疲勞。
Most AR glasses have a fixed image focal plane at approximately 1.5–2 m. Adding binocular disparity to make UI elements appear closer creates a conflict between vergence and accommodation (VAC — Vergence-Accommodation Conflict), causing visual fatigue.
規範方向:資訊型 UI 避免使用近距離雙眼視差;需要表現遠近感時,優先使用大小、透明度、遮擋等 2D 深度線索。互動按鈕與提示框維持在同一 UI 焦平面,避免頻繁切換深度層。
Guideline direction: Informational UI should avoid near-field binocular disparity. When depth perception is needed, prioritize 2D depth cues (size, opacity, occlusion). Interactive buttons and tooltips should stay on the same UI focal plane to avoid frequent depth layer switching.
用視角定義字級,而非 pt 數
Define text size by visual angle, not pt values
AR 顯示距離與一般螢幕不同,直接套用 pt 數會導致字體過小或不一致。規範以視角(°)定義四個文字層級:
AR display distance differs from standard screens — applying pt values directly leads to text that is too small or inconsistent. The guideline defines four text levels by visual angle (°):
| 文字層級Text Level | 目標視角Target Angle | 1.2 m 字高(pt)Height at 1.2 m (pt) | 使用定位Usage |
|---|---|---|---|
| 最小可視Minimum legible | 0.25° | ≈ 15 pt | 最低可辨識門檻,不建議作為主要閱讀字級 Minimum legibility threshold — not recommended for primary reading |
| 內文Body | 0.35° | ≈ 21 pt | 說明文字、短句提示 Descriptive text, short prompts |
| 次標題Subheading | 0.45° | ≈ 27 pt | 選項名稱、區塊標籤 Option labels, section tags |
| 大標題Heading | 0.60° | ≈ 36 pt | 主要標題、狀態標語 Primary heading, status labels |
主要內容集中在視野中心 ±10°,避免長時間抬眼
Keep primary content within ±10° of center gaze to minimize long-duration eye lifting
最佳安全區域為螢幕垂直中心 ±10°,對應畫布(440 × 240 px)中心,上下各留 120 px、左右各留 100 px——讓主要閱讀內容落在最自然的視線範圍內,降低長時間偏轉眼球的疲勞感。
The optimal safe zone is ±10° from the vertical screen center, corresponding to the canvas (440 × 240 px) center with 120 px margin top/bottom and 100 px margin left/right — placing primary reading content within the most natural gaze range to reduce fatigue from sustained eye deviation.
- 圖在上、文字在下:文字末行距下緣 ≥ 100 px
- 互動選項:距上緣 ≥ 100–120 px,避免長時間抬眼觸發
- 單次顯示文字不超過 30–40 字;行距維持字高的 120–140%
- 面板大小上限:垂直 ≤ 12°、水平 ≤ 25°
- Image above, text below: last text line ≥ 100 px from the bottom edge
- Interactive options: ≥ 100–120 px from the top edge to prevent prolonged upward gaze triggering
- Single-screen text: no more than 30–40 characters; line spacing at 120–140% of character height
- Panel size limits: vertical ≤ 12°, horizontal ≤ 25°
Results
人因資料庫與驗證方法應用於產品設計,AR UI 規範作為跨部門設計討論依據。
The ergonomic database and validation method applied to product design; the AR UI guideline serving as a cross-disciplinary design reference.
Product A / B / C 各自驗證光學、鏡框、鼻墊三大區域,共 6 項設計值。每項設計值均對照資料庫分位數,評估在東方/西方族群中的覆蓋範圍,並依據目標市場做相對應的調整建議。
Products A, B, and C each validated across the three zones — optical, frame, and nose pad — covering 6 design values total. Each value was benchmarked against database percentiles to assess coverage in East Asian and Western populations, with targeted adjustment recommendations based on each product's intended market.
結合人因資料庫驗證方法與眼鏡設計結構,共推進 4 件專利,其中 2 件已進入申請程序。
Combining the ergonomic database validation method with glasses structural design, 4 patents total have been advanced — 2 have entered the formal filing process.
Reflection
這個專案讓我學到最多的,不是資料本身,而是跨領域的設計語言。
What I learned most from this project wasn't the data itself — it was the language of cross-disciplinary design.
與機構工程師、工業設計師、光學工程師一起討論眼鏡設計值的容許度,每個人對「這個尺寸合理嗎」的直覺和判斷基準都不同——機構工程師在意製造容差,ID 在意視覺比例,光學工程師在意光路偏差。學會在這幾個語言之間翻譯,找到共同的評估框架,是整個專案最有挑戰也最有收穫的部分。
Working with mechanical engineers, industrial designers, and optical engineers on design value tolerances — everyone's intuition and baseline for "is this dimension reasonable?" differed. Mechanical engineers cared about manufacturing tolerances; ID cared about visual proportions; optical engineers cared about optical path deviation. Learning to translate between these languages and find a shared evaluation framework was the most challenging and most rewarding part of the project.
量化覆蓋率這件事本身,也改變了設計討論的方式——從「這樣看起來好像可以」變成「這個設計值覆蓋 XX% 的亞洲女性,要不要調整」,討論的精確度和效率都提升了。
Quantifying coverage also transformed how design discussions happened — shifting from "this seems like it could work" to "this design value covers XX% of Asian women — should we adjust?" That shift improved both the precision and efficiency of cross-team communication.
Key Takeaways
- 定義人體測量點與眼鏡設計值的對應關係,是整套方法的核心——對應對了,後續分析才有意義
- 量化覆蓋率讓設計討論從感覺判斷變成有數據支撐,跨部門溝通更有效率
- AR UI 的舒適度設計需要回到物理原理:固定焦平面、視角而非 pt 數、眼球運動的自然範圍
- 新興硬體產品沒有現成的設計標準——建立方法論本身,就是設計工作的一部分
- Defining the mapping between anthropometric measurement points and glasses design values is the core of the entire method — get the mapping right, and all subsequent analysis becomes meaningful
- Quantified coverage shifts design discussions from gut judgments to data-backed decisions, making cross-disciplinary communication more efficient
- AR UI comfort design requires returning to physical principles: fixed focal plane, visual angle instead of pt values, natural eye movement range
- Emerging hardware products have no ready-made design standards — building the methodology itself is part of the design work